Reviewed by Lily Ramsey, LLM
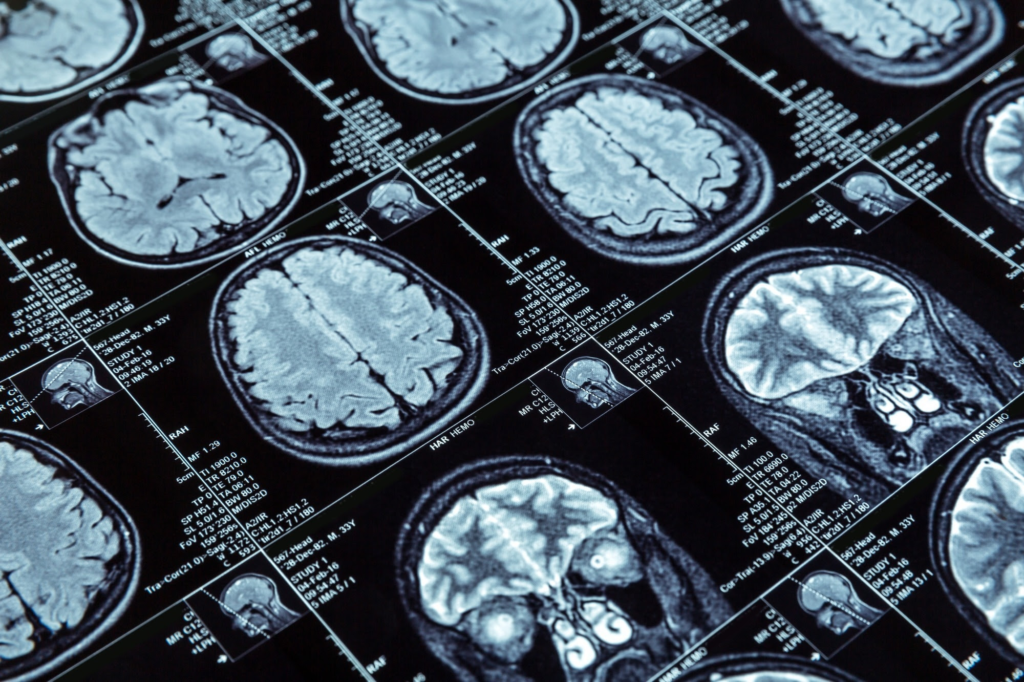
In a recent study published in Molecular Psychiatry, researchers performed structural-type magnetic resonance imaging (sMRI) to develop a machine learning classifier and distinguish neuroanatomical patterns between healthy controls (HCs) and those developing a psychotic disease (CHR-PS+).
Study: Using brain structural neuroimaging measures to predict psychosis onset for individuals at clinical high-risk. Image Credit: Nomad_Soul/Shutterstock.comStudy: Using brain structural neuroimaging measures to predict psychosis onset for individuals at clinical high-risk. Image Credit: Nomad_Soul/Shutterstock.com

Background
Structural MRI is used to diagnose diseases, although its ability to determine psychosis is unclear. The clinical high-risk (CHR) paradigm aids in the early diagnosis and prevention of psychotic disorder.
Individuals at clinically high risk are more likely to acquire psychosis than healthy controls; however, the majority do not transition or have reduced symptoms.
CHR status correlates with changes in brain anatomy, including gray matter volume, cortical surface area, and cortical thickness. Cross-sectional MRI results reveal that those at CHR had a lower CT.
About the study
In the present study, researchers built a machine-learning model to differentiate CHR-PS+ individuals from HCs.
They also investigated whether the model could differentiate CHR-PS+ patients from individuals who showed no signs of psychosis (CHR-PS-) or those with unknown status at follow-up (CHR-UNK).
The researchers collected T1-weighted sMRI brain images from 1,029 HCs and 1,165 CHR individuals across 21 ENIGMA CHR for Psychosis Working Group locations. They used the Desikan-Killiany atlas and the ENIGMA quality evaluation pipeline to extract structural data from 153 sites of interest.
They determined the clinically high-risk status using the Structured Interview for Prodromal Syndromes (SIPS) and Comprehensive Assessment of At-Risk Mental States (CAARMS).
The team used ComBat tools to standardize cortical thickness, surface area, and subcortical volume measurements.
They used cortical surface area, cortical thickness, intracranial volume, and subcortical volume measurements to forecast potential psychosis conversion. They included age, gender, procedure, and side effects as variables.
The researchers applied generalized additive models (GAMs) to HC data, produced non-linear sMRI characteristics corrected for age and biological sex, and regressed intracranial volume effects.
They created an XGBoost classifier that uses CHR-PS+ and HC data to detect aberrations in neuroanatomical developmental patterns. They assessed the predictive ability of the model using the remaining site data.
The researchers evaluated model performance in two steps, splitting the information into the training type, test, independent group, and independent-confirmatory information sets.
They conducted external validation using the test-type and independent-confirmatory information sets, whereas the independent group dataset identified individuals with CHR-UNK and CHR-PS− status across all locations.
The team trained the final classifier model using the optimal hyperparameters and training data and assessed the predictive ability of the machine learning classifier against independent-group data.
They performed four decision curve comparisons and evaluated the classifier on four distinct feature sets: cortical thickness, surface area, subcortical volumes alone, and all characteristics.
They used the model demonstrating the best prediction performance using the independent confirmatory data for further analysis.
Results
The team found that regional cortical surface area significantly influenced the categorization of CHR-PS+ group individuals from HC. Individuals in the CHR-UNK and CHR-PS- categories were more likely to be identified as HC.
A non-linearly fitted SA feature classifier outperformed the CHR-PS+ and HC groups. The model obtained 85% accuracy using the training data. The team achieved the best estimation utilizing the test data (68%) and independent confirmatory data (73%).
They identified the best ten feature weights for separating HC from CHR-PS+ groups, which included the insula, superior frontal, superior temporal, superior parietal, isthmus of the cingulate, fusiform, postcentral gyri, and parahippocampal gyri areas.
Individuals with more clinical symptoms had lower cortical surface areas in the rostral anterior cingulate, lateral prefrontal, and medial prefrontal regions and the parahippocampal gyrus.
Machine learning-based classifiers trained on 152 structural MRI brain features performed worse in the confirmatory analysis than sex- and age-adjusted classifiers.
The researchers also attempted to distinguish clinically high-risk individuals from healthy controls and CHR-PS+ category individuals from those in the CHR-PS- category but only achieved 50% accuracy.
Statistically significant differences in categorized labels were noted, with the healthy control group showing an increased likelihood of being classified as controls compared to CHR-PS+ individuals (73% versus 30%). Independent-group data showed no differences between the CHR-UNK and CHR-PS- groups.
The study revealed significant differences in categorized labels and projected probabilities across four groups of CHR-PS+ patients.
CHR-PS+ individuals differed from those in the other groups, whereas CHR-PS- individuals fell between those in the healthy control and CHR-PS+ groups.
Although the projected likelihood varied by age and group, the team observed no statistically significant age-group interactions. The decision curves showed that acquiring a forecast from the current classifier resulted in a higher net advantage for the CHR discoverer transition.
Conclusion
Overall, the study findings showed that sMRI scans could help determine the prognosis of CHR individuals and distinguish between CHR-PS+ individuals and healthy controls.
The model obtained 85% precision in two-class categorization by non-linearly adjusting cortical surface area variables for sex and age.
Neuroanatomical changes helped identify CHR-PS+ group individuals. The superior temporal, insula, and frontal regions most contributed to distinguishing CHR-PS+ from HCs.
Journal reference:
Zhu, Y. et al. (2024) Using brain structural neuroimaging measures to predict psychosis onset for individuals at clinical high-risk. Mol Psychiatry. doi: https://doi.org/10.1038/s41380-024-02426-7. https://www.nature.com/articles/s41380-024-02426-7

Leave a Reply