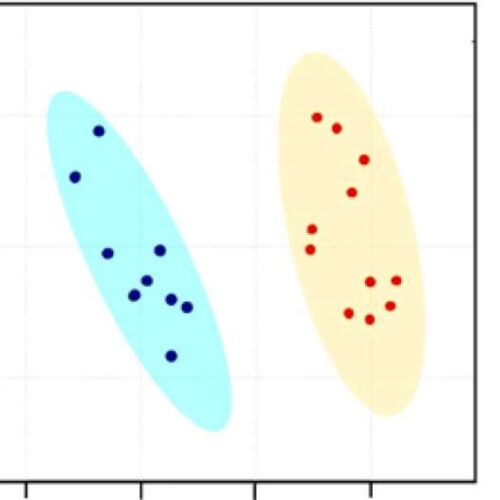
by Clarkson University Figure 1. A principal component analysis (PCA) for the 20 survey subjects. (A) clearly shows two distinct clusters: left blue and right red. (B) shows the average ± SD for each trait. MF, ME, PF, and PE were not significantly different between the two clusters. Credit: DOI: 10.3390/nu14030466 Clarkson University Associate Professor...

