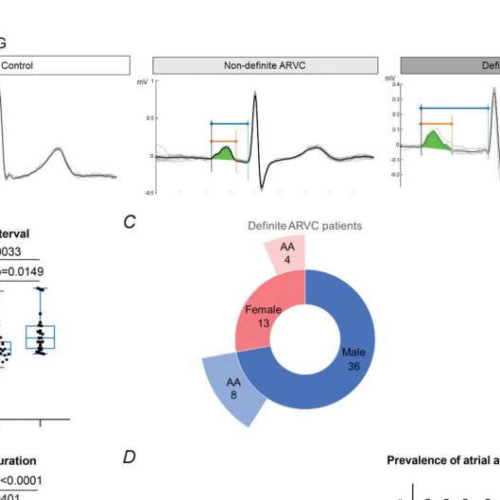
by University of Birmingham A, lead II ECG recordings from an unaffected individual (control) and a non-definite and definite ARVC patient. Individual cardiac cycles over a duration of 10 s (gray traces) are overlaid by detected R waves and averaged (black trace). The PR interval (blue), P wave duration (orange) and P wave area (green) are...
Tag: <span>Anabolic steroids</span>
Post
Anabolic steroids linked to higher rates of premature death in men
Men who use androgenic anabolic steroids–such as testosterone–may face a higher risk of early death and of experiencing more hospital admissions, according to a new Journal of Internal Medicine study. For the study, 545 men who used androgenic anabolic steroids were matched with 5,450 controls. In addition, 644 men who were sanctioned because they refused...

