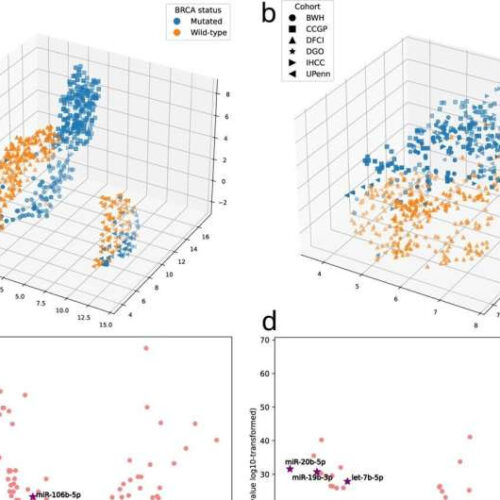
by Dana-Farber Cancer Institute Development of the BRCA-mt signature. UMAP representation of BRCA-mt and BRCA-wt samples from all evaluated cohorts without (a) and after (b) batch adjustment (N = 653). Volcano plots showing differentially expressed miRNAs between BRCA-mutated and wild-type samples without (c) and after (d) batch adjustment (N = 521); red markings represent miRNAs with P < 0.01 and FC > 1.5 or <0.66; purple markings denote ones...

