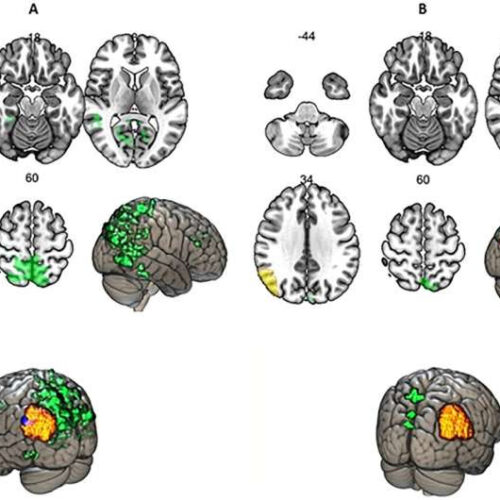
by Leiden University The yellow-red color marks the seed region, the green color demonstrates negative functional interactions, and the blue color demonstrates positive functional interactions. Panel A demonstrates the left IPC caudal cluster functional connectivity when switching to L1 and panel B shows the right IPC caudal cluster functional association under the same condition. Credit: NeuroImage (2022)....

