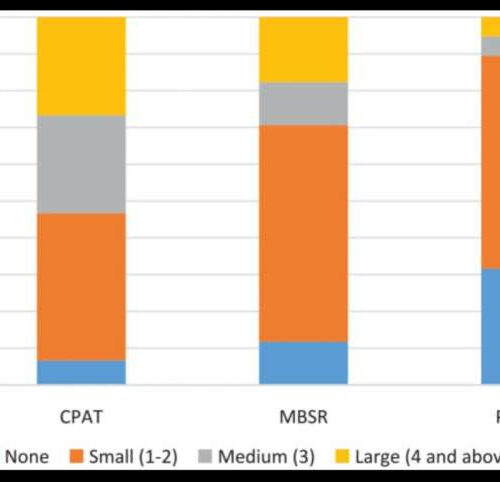
by Tel-Aviv University The proportion of the different levels of Overall Improvement Index (OII) by group.The blue bar represents proportion of participants with no improvement, the orangebar represents proportion of participants with improvements in one to two outcomemeasures, the gray bar represents proportion of participants with improvements inthree outcome measures and the dark yellow bar represents...

