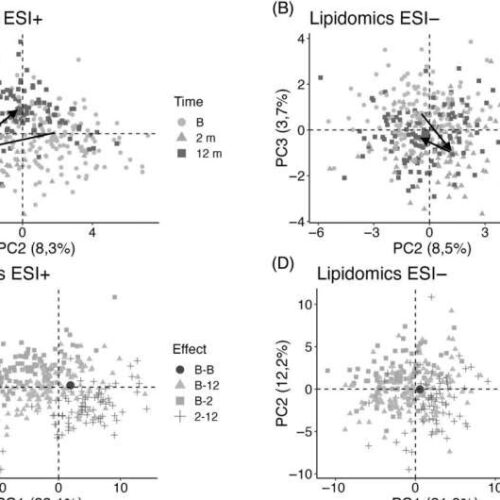
by Lund University PCA score plots for lipidomics data acquired in positive (ESI+; 80 annotated lipids) and negative (ESI-; 46 annotated lipids) ESI mode. PCA was conducted on (A,B) metabolite levels and (C,D) changes in metabolite levels (effects) within defined time ranges: short term (2 months vs. baseline), long term (12 vs. 2 months), cumulative (12 months vs. baseline),...

