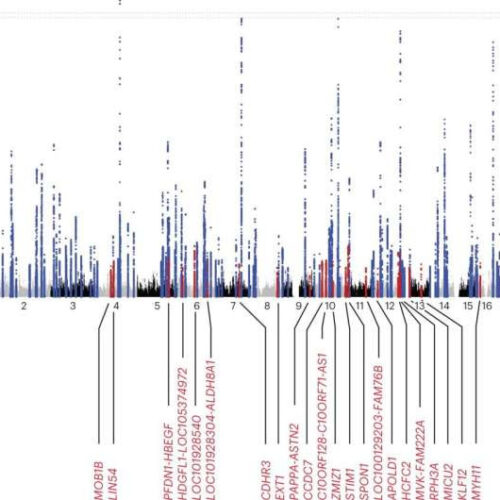
by RIKEN Manhattan plot for the cross-ancestry meta-analysis. The results of the cross-ancestry meta-analysis (77,690 AF cases and 1,167,040 controls) are shown. The log10 BFs on the y axis are shown against the genomic positions (hg19) on the x axis. Association signals that reached a genome-wide significance level (log10 BF > 6) are shown in blue if previously reported...

