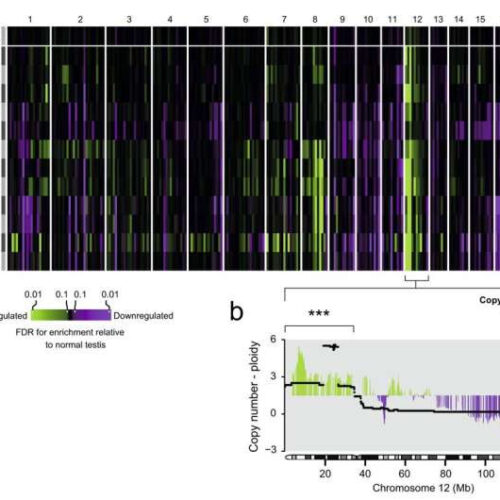
by Wellcome Trust Sanger Institute The relationship between GCT genome and transcriptome. a Heatmap showing gene enrichment per GCT tissue relative to healthy seminiferous tubules, binned by cytoband. Colors correspond to significance of enrichment according to the adjusted p-value (false discovery rate correction). The number next to each histology is the number of eligible microbiopsies...

