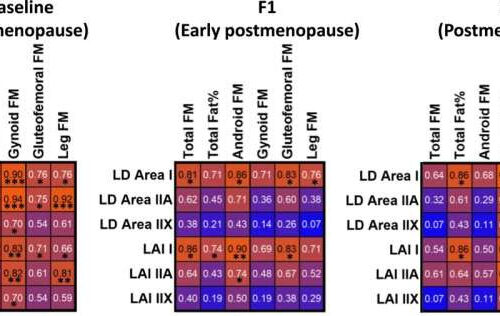
by University of Jyväskylä Correlation matrix of muscle fiber and body adiposity variables at three measurement points (n = 7–10). Correlation strength and direction are illustrated by correlation coefficient and background color. Red indicates a strong positive correlation and white indicates a strong negative correlation. F1, short-term follow-up point; F2, long-term follow-up point; FM, fat...

