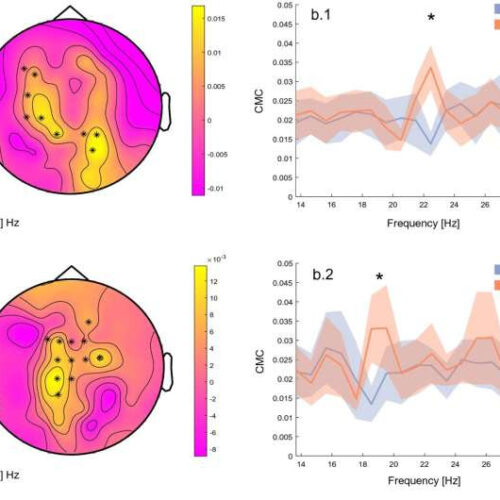
by Aston University Corticomuscular coherence topographic maps and spectra. On the left-side, voltage topographic maps of the difference between EMG-EEG couplings before and EMG-EEG couplings after the WBVs (CMCBB and CMCPSB, respectively), averaged across subjects, are reported for the right GL (a.1) and the right SOL (a.2). The asterisks depict electrodes that showed a significantly bigger...

