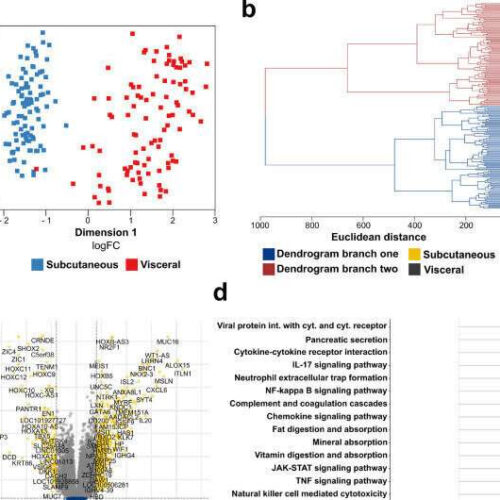
by Technical University Munich SAT and VAT are characterized by different transcriptomic signatures. (a) MDS plot displaying the first two dimensions of the data (n = 99). (b) Hierarchical clustering of SAT and VAT samples based on euclidean sample distances (n = 99). (c) Volcano plot showing differentially expressed genes between SAT and VAT (n = 99). (d) Dotplot displaying the...

