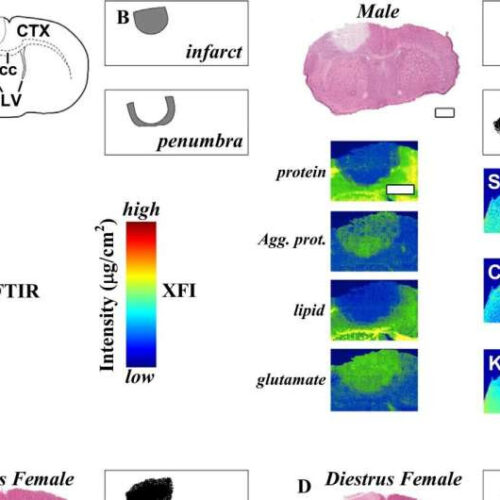
by Erin Matthews, Canadian Light Source Schematic depiction of coronal brain sections, ROIs, and color scales (A). Comparison of male (B) and estrus (C) and diestrus (D) female PT stroke brain sections at 24-hours post-stroke. Representative metabolites and elemental maps from FTIR spectroscopic imaging and XFI, respectively. Scale bars in B for H&E, XFI, and...

