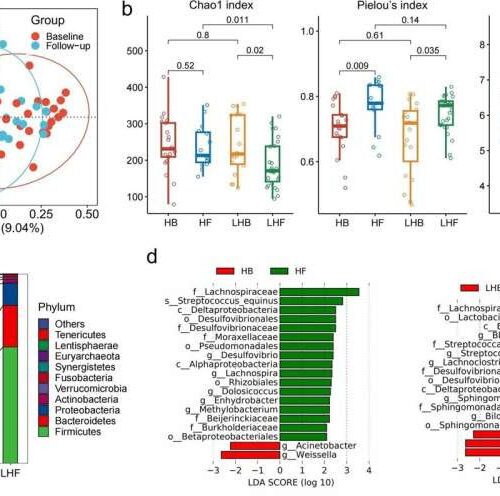
by Justin Jackson, Medical Xpress Comparisons of microbial compositions between baseline and follow-up. (a) aPCoA of the Bray‒Curtis distance plot for baseline and follow-up after adjusting for hypertension, medication use, and alcohol and tea drinking. (b) α-Diversity differences between baseline and follow-up for stratified health statuses (HB, n = 21; HF, n = 15; LHB, n = 19; LHF, n = 27). (c)...

