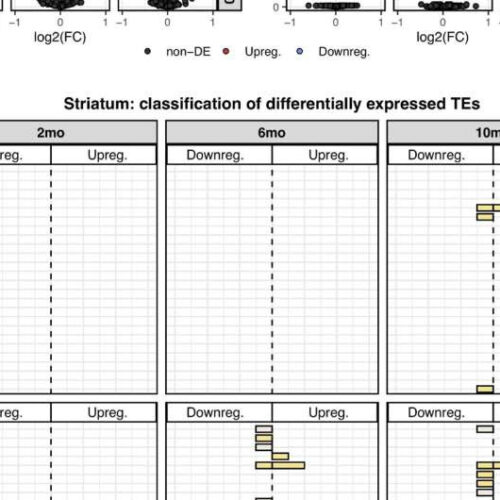
by John Hewitt, Medical Xpress Figure 1. Differentially expressed TEs. (A) Volcano plot showing the murine TE consensus sequences differentially expressed in the striatum of 2-, 6-, and 10-mo mice in Q111 and Q175 genotypes compared to control (Q20). Blue color indicates the TE consensus sequences that result downregulated in each tested comparison (Q111 vs....

