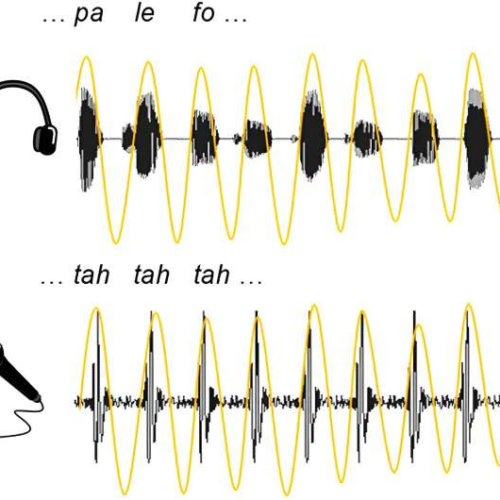
by Idun Haugan, Norwegian University of Science and Technology Example of the SSS test. The upper panel represents the perceived, and the bottom panel the produced, speech signals. The yellow lines represent the envelope of the signals, bandpass-filtered between 3.5 and 5.5 Hz. Estimation of synchronization ability is quantified as the phase-locking value (PLV) between the...

