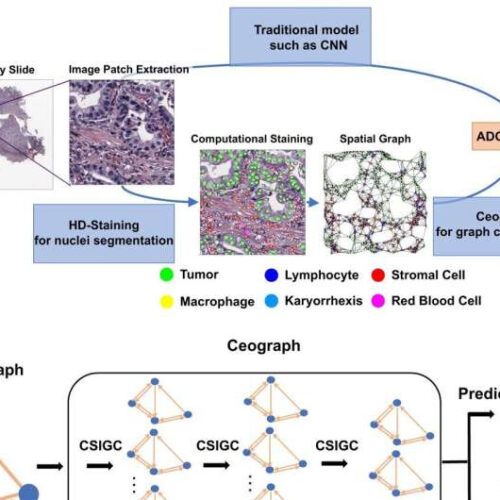
by UT Southwestern Medical Center Illustration of using Ceograph for pathology image classification. a Flowchart of traditional image classification (upper arrow) and Ceograph (bottom arrow). The Ceograph method includes nuclei identification through HD-Staining, graph construction, and classification. The application to lung cancer histology subtype classification is used as an example. The image patches are 1024 × 1024 pixels...

