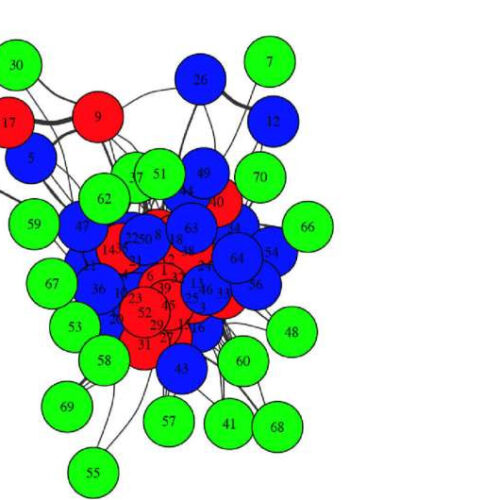
by Timothy Dean, The Geisel School of Medicine at Dartmouth Network plots for the Miami HRR (Panel A: 2002, Panel B: 2009). The 2009 plot is restricted to the most connected agencies of number equal to the total number of agencies in 2002. The nodes are colored with red (most), blue and green (least) corresponding to...

